Administration
Analytics
Production, engagement and quality: what the Analytics page shows, depending on your role.
Updated on
The Analytics page is your home page. Everyone sees what concerns them: their tasks, their activity and, for team leads, the state of the content.
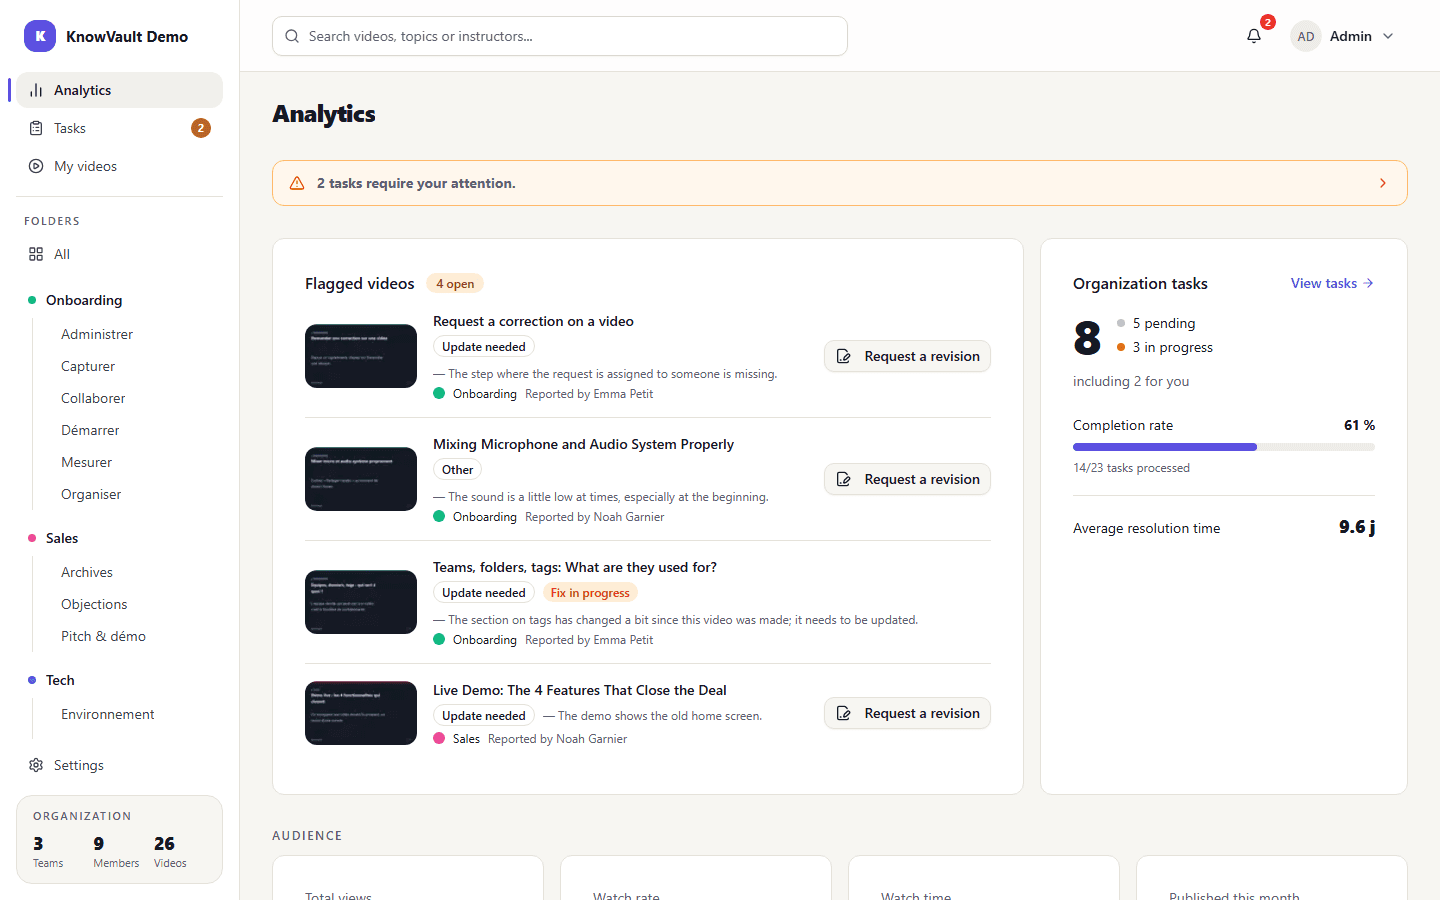
What each person sees#
| Block | Visible to | What it shows |
|---|---|---|
| My tasks | Everyone | Pending requests assigned to you, with their due dates |
| My sent tasks | Everyone | Progress on the requests you made |
| Your statistics | Viewers | Videos watched, training time, completion rate, bookmarks |
| Your statistics | Contributors and managers | Published videos, total engagement, most-watched video, completed tasks |
| Flagged videos | Managers and administrators | Videos with open reports |
| Quality & responsiveness | Administrators | Average resolution time, completion rate, open reports, organization tasks |
| Overall engagement | Administrators | Total views, full-view rate, watch time, videos published this month |
| Content production | Administrators | Top videos and top contributors, with their completion rates |
A video's figures#
Each video also shows its own metrics: average watch time, completion rate and number of bookmarks. A video counts as fully watched at 90%.
Tip
A low completion rate often points to a video that is too long: split it into several videos that each answer a single question.